

Bunker Fuel Market on Track to Reach $ 185,120 million by 2035 as Decarbonization Rewrites Marine Energy Economics
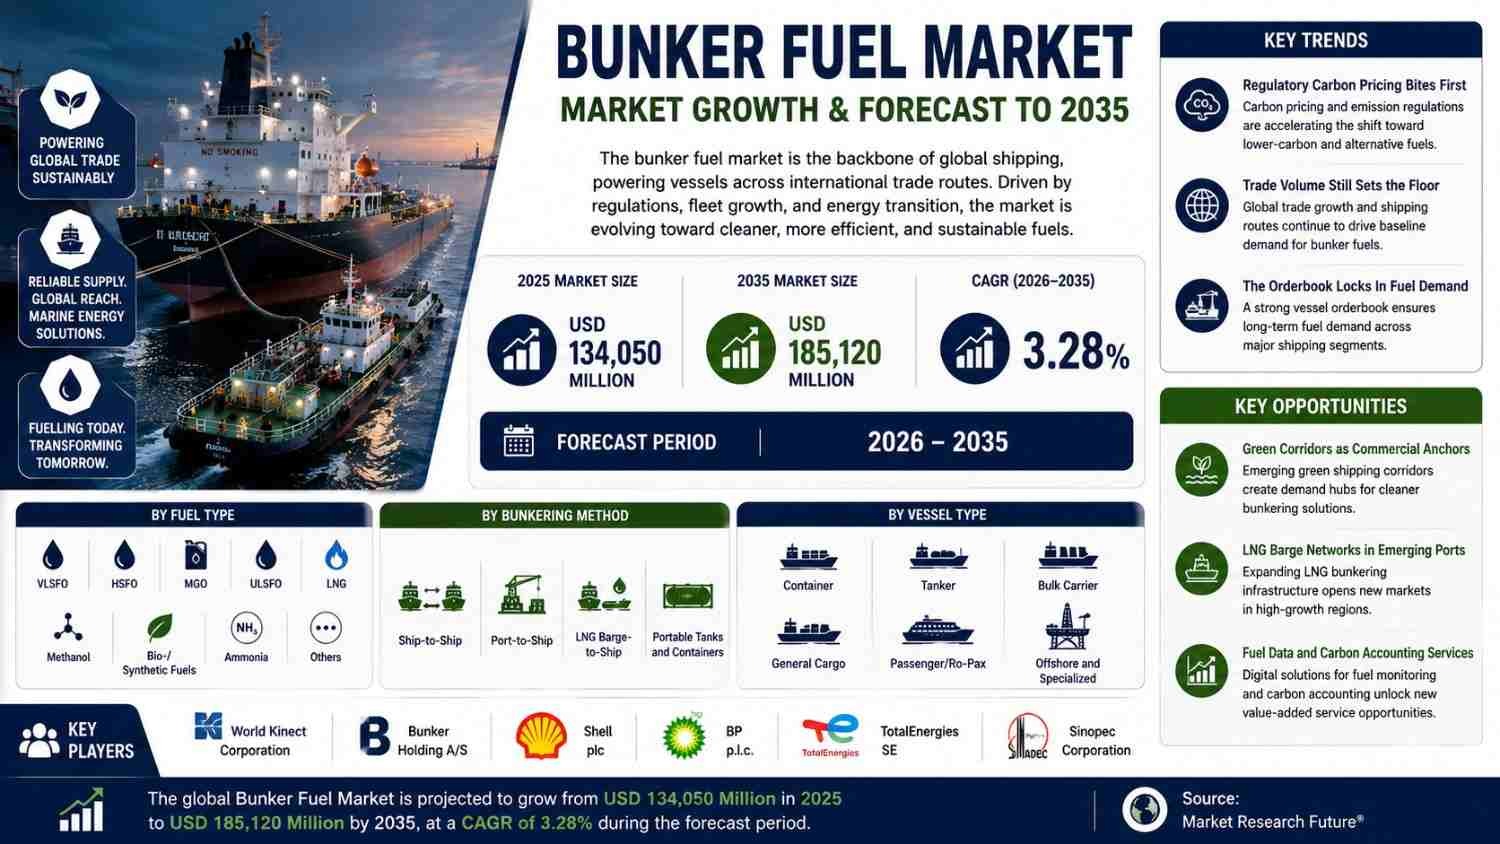
Bunker Fuel Market (2026 - 2035)
The Asia-Pacific region anchors the Bunker Fuel Market, accounting for 44.6% of 2025 value, propelled by Singapore’s ~55 million tons of yearly sales
EUROPE, UNITED ARAB EMIRATES, August 20, 2026 /EINPresswire.com/ -- The global bunker fuel market is navigating the most consequential regulatory transformation in its modern history. Valued at an estimated USD 134,050 million in 2025 and opens the forecast window at USD 138,450 million in 2026, climbing to USD 185,120 million by 2035 at a 3.28% CAGR. While the headline growth rate appears modest, the underlying story is one of radical fuel-mix transition. Very-low-sulfur fuel oil, liquefied natural gas, methanol, and bio-blends are displacing the high-sulfur residual grades that dominated marine propulsion for decades, while international carbon pricing converts environmental compliance from a cost center into a commercial product layer.The Regulatory Architecture Reshaping Marine Fuel
Two overlapping policy frameworks are fundamentally rewriting bunker economics. The International Maritime Organization's Net-Zero Framework, approved in April 2025, establishes the shipping sector's first worldwide greenhouse-gas fuel-intensity standard and pricing mechanism. This creates a direct carbon cost on every tonne of fuel burned, permanently altering procurement calculations for vessel operators.
Simultaneously, the European Union's Emissions Trading System now covers 100% of emissions on intra-European Union voyages and half of emissions on inbound and outbound legs from 2026. FuelEU Maritime requires a 2% reduction in fuel greenhouse-gas intensity from 2025, tightening to 14.5% by 2035. Owners calling Rotterdam now carry an allowance cost that can exceed $90 per tonne of conventional residual fuel. That spread makes compliant blends and liquefied natural gas commercially defensible rather than merely virtuous.
These policies are pulling forward capital deployment at an unprecedented pace. DNV tracks more than 1,300 vessels on order that are capable of burning alternative fuels, and Lloyd's Register forecasts that investment in retrofitting and newbuild propulsion associated with shipping decarbonization will consume more than $40 billion of owner capital through 2030. Ships ordered today serve for 25 years, so 2026 contracting decisions effectively determine 2045 fuel slates. Shipowners are hedging by specifying dual-fuel engines even where the alternative fuel supply chain remains thin.
Market Size and Forecast Trajectory
Market Research Future's estimates combine port authority sales disclosures from Singapore, Rotterdam, Fujairah, and Zhoushan with refinery yield statistics, vessel-call databases, and delivered-price series. Value is derived from volume using trade-lane-weighted delivery prices and validated against operator fuel-cost line items. The market has grown from $108.9 billion in 2021 and is expected to reach $147.68 billion by 2028 before climbing steadily toward the $185.12 billion endpoint in 2035.
Download Report Sample Copy with TOC: https://www.marketresearchfuture.com/sample_request/10871
Segment Analysis by Fuel Type
Very-low-sulfur fuel oil commands the largest share of the bunker fuel market, capturing approximately 41.8% of value in 2025. Its dominance is a durable consequence of the 2020 sulfur cap. It satisfies global limits without capital investment, and refinery blending capacity has caught up with demand. For most vessel operators, VLSFO remains the default compliant grade across most trade lanes.
High-sulfur fuel oil generated approximately $30.03 billion in 2025, retaining a substantial position because scrubber payback economics remain attractive whenever the VLSFO-to-HSFO spread widens beyond roughly $100 per tonne, which it has done repeatedly since 2022. Vessels with scrubbers installed can burn cheaper HSFO while remaining compliant, creating a two-tier market that persists despite environmental pressure.
Marine gasoil captured roughly 18.6% of the market, serving emissions control area compliance and auxiliary engine demand where distillate quality is non-negotiable. Ultra-low-sulfur fuel oil is growing at a 2.14% CAGR, serving niche emissions control area-specific demand.
Liquefied natural gas is the fastest-growing established fuel class, expanding at an 11.4% CAGR through 2035. This reflects the dual-fuel newbuild delivery wave, with LNG offering an immediate greenhouse-gas intensity reduction of approximately 20% versus conventional fuel oil on a tank-to-wake basis. However, barge availability rather than vessel capability has been the binding constraint on LNG uptake at most ports outside Northwest Europe and Singapore.
Methanol reached approximately $1.88 billion in 2025. While small in absolute terms, this segment is doubling roughly every three years, driven by liner operator commitments from Maersk and others who have bet heavily on green methanol as their primary decarbonization pathway.
Bio and synthetic fuels are the fastest-growing fuel category overall, advancing at a 16.8% CAGR. B24 and B30 blends are available in Singapore and Rotterdam but scarce elsewhere, creating an underserved gap for certified blending capability in secondary hubs. Ammonia remains in the pilot and demonstration phase, capturing roughly 0.2% of the market, though the orderbook is already committing to ammonia-ready vessels. Other fuels including hydrogen and residual specialties contributed approximately $536 million.
Segment Analysis by Bunkering Method
Ship-to-ship delivery dominates the market, accounting for approximately 52.6% of value in 2025. This method removes berth dependency, letting vessels bunker while at anchor or during cargo operations. It is the default mode at Singapore and Fujairah, the world's two largest bunkering hubs.
Port-to-ship delivery generated approximately $51.07 billion, serving pipeline-connected terminal calls where vessels can lift fuel alongside cargo operations. LNG barge-to-ship is the fastest-growing bunkering method, expanding at a 12.7% CAGR. Barge availability has been the binding constraint on LNG uptake, and building barge capacity in Indian, Brazilian, and West African hubs represents a significant first-mover opportunity. Portable tanks and containers captured roughly 2.9% of the market, serving small vessels and pilot alternative fuel volumes with far less capital than pipeline or barge infrastructure.
Buy Now: https://www.marketresearchfuture.com/checkout?currency=one_user-USD&report_id=10871
Segment Analysis by Vessel Type
Container vessels command the largest vessel-type share, capturing approximately 31.4% of demand in 2025. This reflects their high utilization rates and long-haul service patterns, where liner schedules demand sustained service speeds that burn disproportionate fuel relative to fleet share.
Tankers generated approximately $33.11 billion in 2025, ranking second on tonne-mile intensity. Their demand tracks crude trade re-routing closely, and the shift of Russian crude toward Asian buyers lengthened voyages substantially, lifting associated consumption. Bulk carriers captured roughly 22.9% of the market, serving iron ore, coal, and grain flows.
Passenger and roll-on/roll-off-passenger vessels are the fastest-growing vessel type, expanding at a 4.62% CAGR. This reflects cruise capacity recovery following the pandemic and shore-power mandates that reshape port-stay consumption patterns. General cargo is growing at a 2.71% CAGR, while offshore and specialized vessels are expanding at a 3.94% CAGR, driven by offshore wind installation vessel demand.
Regional Landscape: Asia-Pacific Dominates, Middle East and Africa Accelerates
Asia-Pacific anchors the bunker fuel market with approximately 44.6% of global revenue in 2025. Regional performance tracks hub concentration more than national consumption, with five ports handling a disproportionate share of global volume. Singapore alone represents the largest single-port volume, with sales near 55 million tonnes in 2024 and a mass flow metering regime that removed most quantity disputes. The port has licensed additional liquefied natural gas and methanol supply operators, competing on alternative fuel availability rather than price alone. China captures roughly 26.4% of the regional share through Zhoushan bonded bunker expansion, which has grown into the clear number two Asian hub by pricing aggressively and licensing additional physical suppliers. India contributed approximately 6.1% of the regional share through coastal shipping and Visakhapatnam capacity growth. Japan holds roughly 8.7% through ammonia and liquefied natural gas technology programs. South Korea captures approximately 7.3% through newbuild yard delivery bunkering. The ASEAN bloc dominates with roughly 42.8% of regional share, almost entirely through Singapore. The rest of Asia-Pacific contributed approximately 8.7% through Australian bulk export lanes.
Europe holds the second-largest global share at approximately 24.2%, carrying the heaviest regulatory load and the deepest compliance expertise. Rotterdam sold roughly 9.7 million tonnes in 2024 and has become the reference point for European bio-blend availability. FuelEU Maritime's pooling mechanism lets operators average intensity across a fleet, which concentrates low-carbon lifting at a few well-supplied ports rather than spreading it. Germany anchors the region with approximately 9.8% of European share through Hamburg container throughput. The United Kingdom captures roughly 8.4% through North Sea offshore and transit calls. France holds approximately 6.9% through the Marseille-Fos Mediterranean position. Italy contributed approximately 7.2% through roll-on/roll-off and cruise concentration. Spain captures roughly 11.6% through Algeciras and Las Palmas transit hubs. The Nordic countries hold approximately 10.3% of the regional share as liquefied natural gas bunkering leaders. Russia captured roughly 5.1% through redirected Baltic and Far East flows. The rest of Europe contributed approximately 40.7% of regional share, with the Amsterdam-Rotterdam-Antwerp cluster dominating.
North America generated approximately $19.84 billion in 2025. The United States dominates with roughly 71.4% of the regional share, with Gulf Coast refining and Houston bunkering providing the region's structural advantage. Refinery proximity keeps Houston and New Orleans price-competitive against Caribbean alternatives, and volumes have held steady even as West Coast port-stay burn declines under California's At-Berth Regulation, which requires shore power or equivalent emissions capture for most container, cruise, and refrigerated vessel calls. Canada contributed approximately 17.2% through Pacific bulk exports and Vancouver calls. Mexico captured roughly 11.4% of the regional share through Manzanillo and Veracruz container growth.
South America was valued at approximately $4.05 billion in 2025, expanding at a 3.02% CAGR. Brazil dominates with roughly 63.8% of the regional share through Santos and Paranaguá agri-export volumes. Argentina contributed approximately 14.7% through the Rosario grain corridor. The rest of South America captured roughly 21.5% through Panama Canal transit bunkering, though drought restrictions redirected traffic and altered patterns across the region.
The Middle East and Africa is the fastest-growing region, expanding at a 4.15% CAGR. The United Arab Emirates leads with approximately 38.6% of regional share through Fujairah anchorage volumes, where storage capacity and position outside the Strait of Hormuz make it the regional price setter. Saudi Arabia captures roughly 21.3% through Jeddah and Jubail refinery integration. South Africa contributed approximately 12.4%, seeing an unexpected windfall as Red Sea diversions pushed traffic around the Cape, though offshore delivery constraints capped how much demand the country could actually serve. Egypt holds approximately 9.8% through Suez Canal transit calls. The rest of the region contributed approximately 17.9% through East and West African offshore support.
Report Summary: https://www.marketresearchfuture.com/reports/bunker-fuel-market-10871
Competitive Landscape
The bunker fuel market exhibits medium concentration, with an estimated Herfindahl-Hirschman Index between 520 and 610 and the top five suppliers accounting for approximately 31 to 35% of global value. Physical supply is regional, but trading and reselling is consolidated around a number of global middlemen, creating a two-tier structure in which ownership of a local terminal is as important as global size.
World Kinect Corporation leads with an estimated 8 to 11% revenue share, operating the largest independent reseller network with global physical supply, trading, and fuel management services. Bunker Holding A/S captures roughly 7 to 10% through its Dan-Bunkering and KPI OceanConnect trading arms, offering the broadest broker and reseller footprint. Shell plc holds approximately 6 to 9% as a leader in liquefied natural gas bunkering infrastructure, offering VLSFO, liquefied natural gas, bio-blends, and marine lubricants.
BP p.l.c. accounts for roughly 5 to 7% through an integrated refining-to-delivery chain for residual and distillate grades and biofuel blends. TotalEnergies SE captures approximately 4 to 6% with liquefied natural gas bunkering, VLSFO, and methanol pilots, including dedicated liquefied natural gas bunker vessels. Sinopec Corporation holds roughly 4 to 6% as the dominant Zhoushan physical supplier and bonded bunker operator at Chinese ports.
ExxonMobil Corporation captures approximately 3 to 5% with a strong emissions control area-compliant fuel portfolio spanning VLSFO, marine gasoil, and marine lubricants. Chevron Corporation holds roughly 3 to 4% through distillate and residual marine fuels with Americas and Asia terminal access. Minerva Bunkering accounts for approximately 3 to 4% with deep Mediterranean and Amsterdam-Rotterdam-Antwerp presence through physical supply and barge operations. Peninsula captures roughly 2 to 4% with floating storage and anchorage strength at Gibraltar and Fujairah. Monjasa A/S holds approximately 2 to 3% as a West Africa and Middle East specialist. PetroChina Company Limited rounds out the competitive set with roughly 2 to 3% through state-backed domestic distribution and bonded bunkers.
Related Report
retail fuel Market https://www.marketresearchfuture.com/reports/retail-fuel-market-28597
Aviation Fuel Market https://www.marketresearchfuture.com/reports/aviation-fuel-market-8418
marine biofuel market https://www.marketresearchfuture.com/reports/marine-biofuel-market-25237
algae fuel market https://www.marketresearchfuture.com/reports/algae-fuel-market-24851
Non-Fuel Grade Alcohol Market https://www.marketresearchfuture.com/reports/non-fuel-grade-alcohol-market-7759
Market Research Future
Market Research Future
+1 855-661-4441
email us here
Legal Disclaimer:
EIN Presswire provides this news content "as is" without warranty of any kind. We do not accept any responsibility or liability for the accuracy, content, images, videos, licenses, completeness, legality, or reliability of the information contained in this article. If you have any complaints or copyright issues related to this article, kindly contact the author above.
